Cool Jobs: Data detectives
From health and the environment to sports, statisticians uncover valuable information that would otherwise remain buried in mountains of data

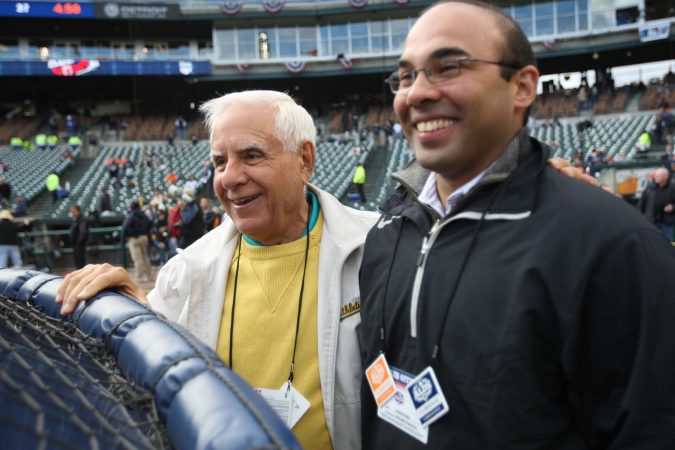
Yoenis Cespedes (shown here) led the Oakland Athletics to the Major League Baseball playoffs in 2012. Before the season’s start, the Athletics signed Cespedes to a large contract, even though he had never played an inning of baseball in the United States. What’s more, other teams considered him too big a risk. But Farhan Zaidi, a statistical guru, based his decision “on the numbers.”
Michael Zagaris, Oakland Athletics
When Lee-Ann Hayek got her first job at the Smithsonian Institution in Washington, D.C., she wasn’t expecting to spend her whole career there. She had just received her doctorate in statistics. She recalls thinking it would be fun to work at one of the Smithsonian’s famous museums or research centers. So, “I just wrote them a letter and said, ‘I’ll dust your elephants if you want!’”
Today, 35 years later, Hayek works at the National Museum of Natural History. As the Smithsonian’s chief mathematical statistician, Hayek doesn’t do any dusting. (She does, however, get to see its stuffed elephant, Henry, any time she wants.) A detective of sorts, Hayek digs into the raw numbers, called data, churned up by hundreds of Smithsonian experts doing cutting-edge research in a wide range of fields.
Statisticians like Hayek specialize in identifying patterns in data. Some work to make the data more manageable. Others may use it to make predictions. Just as importantly, their work provides a reality check for other scientists. Statisticians diagnose patterns that may appear to be there but are probably due to what is called “noise” — unwanted and random variations in data.
The scientists Hayek works with may be the world’s leading experts on a particular topic. Still, those experts may not understand the best way to analyze the data they collect. “Theory is well behaved, but data never are,” Hayek jokes.

Here we meet three statisticians who have made a career of sifting through numbers to answer hard questions. The trends they discover bring meaning to diverse aspects of our world, from art and animals to brains and baseball.
“I can solve that!”
Though not part of the Smithsonian Institution, the National Gallery of Art is one of many museums clustered along a stretch of parkland in Washington, D.C., known as the Mall. The National Gallery has one of the world’s largest collections of portrait medals from the Italian Renaissance. That’s an artistic period that ran from about 1350 to 1600.
One day, the National Gallery’s senior chemist, Lisha Glinsman, came to Hayek with a question. Could the different recipes used to make bronze help experts figure out which artist had created any particular unsigned medal? What an interesting question, Hayek thought. So she decided to look for an answer.

Statisticians learn to analyze data in several ways. The simplest is through descriptive statistics. Here they take a collection of data and describe it mathematically. For instance, statisticians may measure its mean (or average value) and the variance (a measure of whether the data are all close to the mean or spread far apart).
Using descriptive statistics, Hayek found each bronze medal had been made from one of seven or eight different alloys (or mixtures of different metals). Each alloy, for example, contained different average percentages of copper, tin, lead or zinc. The biggest surprise: No alloy was the exclusive recipe of just one artist. In the same way that a sculptor might select from among several types of stone, depending on what subject he was portraying, each bronze-worker used several alloys.
This discovery “just turned the project around,” Hayek says. It showed that bronze in Renaissance Italy had not been a single generic product, prepared by each workshop in its own way. Instead, there were many types of bronzes. Craftsmen chose different recipes for different purposes. And it seemed no accident, Hayek says: “These people knew what they were doing!”
Panda stats
A second type of statistics is called inferential. It typically involves “significance tests.” These math tests try to determine whether an apparent pattern is real or likely due just to chance. A project Hayek worked on involving giant pandas offers a good example.
For many years, scientists in China had been vaccinating their native pandas against diseases common in dogs and other domestic animals. In fact, the experts used vaccines that had been designed for dogs. Some Chinese veterinarians worried that dog vaccines might not protect pandas all that well.
To check that out, the veterinarians sent Hayek data on blood samples. The vets had collected the blood from 19 pandas in China over a six-year period. At once, Hayek detected a troubling pattern.

Vaccines also should be consistent, producing similar results every year. But Hayek found that panda antibody levels changed dramatically from year to year. Something must be wrong!
It wasn’t clear right away if the variations were real and the vaccine’s fault. Random fluctuations in the pandas’ blood might cause antibody levels to spike one year and fall the next. If the vaccine wasn’t to blame, the scientists might spend a lot of money trying to fix a problem that didn’t exist.
But Hayek’s mathematical tests left little doubt. She detected variations in immunity that were too big and too systematic to be due solely to chance. Her work confirmed what her veterinarian colleagues had suspected: China’s vaccine makers were not producing a consistent product. In some years, vaccine quality was poor. Pandas in those years lacked good protection from disease.
This shows why statistics is like detective work. Descriptive statistics detect a pattern that’s out of the ordinary. Inferential statistics catch the culprit (or prevent the arrest of an innocent bystander). “It doesn’t always take advanced math,” Hayek explains. “But it does take a tremendous amount of reading and knowledge to look at a problem and say, ‘I can solve that. I don’t know how, but I know that I can.’”
Statistics on the brain
You might say that Brian Caffo has numbers on the brain. A whole lot of them.
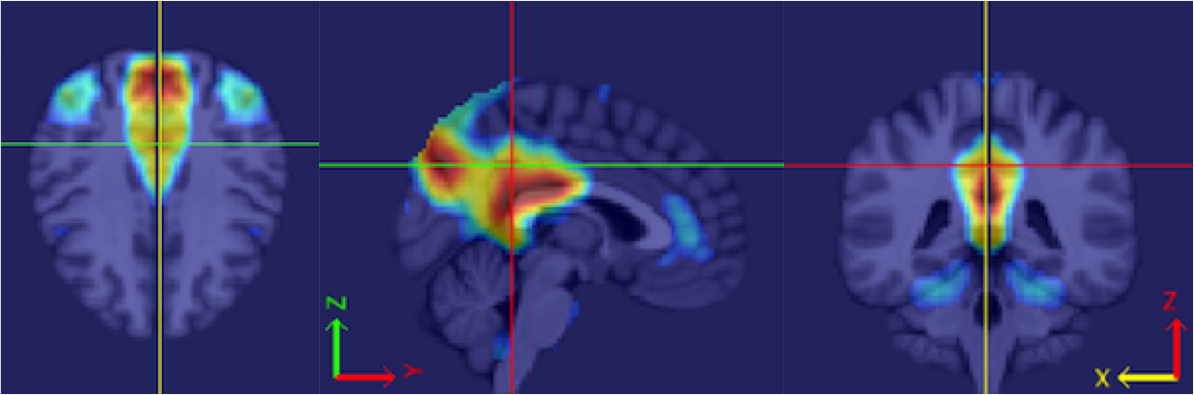
Caffo’s specialty is a kind of brain scan called “functional magnetic resonance imaging” — or fMRI for short. Unlike X-rays, which show only the brain’s structure, the colorful pictures created using fMRI show the brain at work. Neuroscientists are especially interested in seeing which parts of the brain light up (and which don’t) when someone does a particular task. This helps them map connections between different parts of the brain.

Caffo works at the Bloomberg School of Public Health at Johns Hopkins University in Baltimore. There, he separates real brain signals contained in fMRI images from meaningless static. Statistics provides the tools he needs to erase that confusing “noise.”
Using fMRI images for prediction poses a challenge, however. Usually, scientific theories relate one quantity (which we’ll call x) to another quantity (which we’ll call y). For example, how fast a person throws a ball (x)determines how far it will go (y). But what can be done when the values for x or y are not numbers, but pictures?
So far, the best solution has been to turn pictures into numbers. Doing that creates a lot of numbers. Think of the old saying: A picture is worth a thousand words. But with a single fMRI scan, a picture may translate into hundreds of thousands of numbers. Statisticians need fancy math to compress and process these data in ways that give scientists something meaningful.
Curiously, Caffo did not expect to work in either biology or statistics when he first entered college. “I started as an art major,” he recalls. But he struggled, getting mediocre grades in his art classes. Meanwhile, he also took math classes — and did quite well. Eventually, he switched his major to math.
Later, a chance to do some cancer research at the University of Florida convinced Caffo to enter a field called biostatistics. It uses math to find trends in biomedical data. They might include numbers that help identify who gets sick or how well a treatment helps people.

Caffo didn’t know much about the brain before he came to work at Johns Hopkins. In science today, that’s not as big a problem as it might seem, he says. Large teams of people carry out brain research. None is an expert in every part of that research. “We have a neuroscientist, a medical doctor, an engineer, a statistician, technical people who know how to run the scanner and applied mathematicians,” Caffo says. “The best strategy is to know your component well.”
In 2011, at age 38, Caffo won a Presidential Early Career Award for Scientists and Engineers. He and the other award winners received an invitation to the White House. Caffo learned he was the only “statistician” among the winners. However, he quickly realized that a huge share of the other winners used statistics too.
“You may meet another person whose title is ‘psychologist’ or ‘sociologist’ or ‘epidemiologist.’ But their work,” Caffo explains, “is 100 percent doing statistics as it applies to that area.” The lesson for students, he says, is this: “If you get into science, you’re going to do statistics — no matter what.”
Moneyball: It’s all about numbers
The 21st century has brought a new era to baseball. It is one defined as much by the quiet hum of a computer as by the crack of a bat. Gone are the days of basing important decisions on hunches and traditions. Teams have begun making decisions scientifically. And increasingly, they base them on data. Nobody represents this new era better than Farhan Zaidi. He’s the director of baseball operations for the Athletics, a major league team in Oakland, Calif.
In the early 2000s, the Oakland Athletics became one of the first teams to openly use math to assess the value of individual ballplayers. The team’s general manager was Billy Beane. Back then, the Athletics didn’t have much money to spend on player salaries. Still, the team enjoyed a successful run. And it did so by identifying talented players that other teams ignored — that is, good players who came cheap.
Moneyball, a 2003 book (made into a 2011 movie by the same name) told the story behind the team’s success. Zaidi, then a graduate student in behavioral economics, read the book and found it an “inspiration.” He had always been a fan of baseball. Yet he had assumed a career in the game was unthinkable for someone like him (who had last played baseball in Little League). Moneyball, he says, “showed that people with less conventional backgrounds might have a chance to get involved in the game.”
Such a chance for him came sooner than he expected.
“When Billy [Beane] called to offer me the job, I was so excited that I grabbed an index card and wrote his cell phone number on it,” Zaidi says. “I still have that card on the bulletin board in my office. I keep it up there because this is a dream come true.” Even when the team wins only two of seven games during a road trip, “I come back home and look up at that card. It reminds me that every day at this job is a gift.”
If so, Zaidi has earned it. His statistical analyses supported a gamble that Oakland took in 2012. That’s when it offered a big contract to an unproven Cuban immigrant named Yoenis Cespedes. No other team thought he was worth the salary Oakland offered. Cespedes joined the Athletics and turned out to be one of the biggest stars of the year, leading his team to the playoffs.
The ‘analytics’ of baseball
Zaidi contributes to the team in ways both large and small. He scouts upcoming opponents. He then uses statistical analyses to recommend where fielders should position themselves against different batters. He also evaluates all the players in the minor league system. There is no surefire way to determine who will become a successful major-leaguer. Still, statistics have revealed some patterns that wouldn’t be obvious to fans or even to coaches.
For example, “We try to focus more on skills than on outcomes,” Zaidi told Science News for Students. That means he doesn’t pay much attention to certain traditional measures, such as batting average. “A batting average is an outcome,” he points out.
Zaidi’s methods are constantly evolving. “Our original indicator was strikeouts,” he says, in explaining how he would scout the potential of minor-league pitchers. Now, he no longer focuses on just the number of strikeouts. Zaidi instead analyzes how many pitches are thrown to strike out each batter.
“Some pitchers dominate hitters, striking them out on three or four pitches,” Zaidi explains. “Others may miss on a bunch of pitches, get a few fouls and then strike them out.” He now believes a 10-pitch strikeout isn’t a good predictor of a pitcher’s success — at least in the big leagues.
Experts, especially in the business world, describe the analysis of trends hidden in huge amounts of data with the term analytics. In the nine years since Zaidi joined the Athletics, analytics has taken hold throughout baseball. “I think every team’s front office has someone working on analytics,” he says. It’s becoming accepted in other sports too. MIT, where Zaidi went to college, now holds a major conference on sports analytics every year.
Zaidi always tries to remind himself that using math to identify meaningful trends (such as three-pitch versus 10-pitch strikeouts) requires greatly simplifying what happens in the real world. So it pays to be humble, he says. “I think that people are more willing to listen to you when they see that you take your own work with a grain of salt.”
Now, when your classmates dismiss mathematics or statistics, asking what they are good for, you can tell them: They help people in all walks of life (and pandas). Data detectives work behind the scenes to make everything we do a little better.
Power Words
alloy A blend of two or more metals in which the individual elements are thoroughly mixed at a microscopic level.
Alzheimer’s disease A degenerative disease of the brain that usually affects elderly people. It leads to worsening memory, confusion and eventually death. No cause or cure is known.
analytics A term largely used in the business world to mean the interpretation of large quantities of data. Similar to statistics, it has a greater focus on real-world applications.
antibody Any of a large number of proteins that the body produces as part of its immune response. Antibodies neutralize, tag or destroy viruses, bacteria and other foreign substances in the blood.
batting average A traditional measure of batting skill in baseball. It’s the number of hits that a batter gets, divided by the total number of times a player came up to bat.
biomedicine The field of research that explores the biological basis of injuries or disease and their treatments.
biostatistics Statistics applied to biology or medicine. When it’s used for neurology, it’s called neurostatistics.
brain scan The use of an imaging technology, typically using X-rays or a magnetic resonance imaging (or MRI) machine, to view structures inside the brain. With MRI technology — especially the type known as functional MRI (or fMRI) — the activity of different brain regions can be viewed while the patient is doing something, such as viewing pictures, computing sums or listening to music.
bronze A metallic alloy that consists primarily of copper and tin, but may include other metals. It is harder and more durable than copper.
copper A metallic chemical element in the same family as silver and gold.
doctorate (also known as a PhD or doctoral degree) An advanced degree offered by universities — typically after five or six years of study — for work that creates new knowledge. People qualify to begin this type of graduate study only after having first completed a college (a program that typically takes four years of study).
domestic animal A tame animal that commonly lives with people, such as a dog, cat or horse.
engineer A person who uses science to solve problems. As a verb, to engineer means to design a device, material or process that will solve some problem or unmet need.
foul In baseball, a ball hit outside the defined field of play. A foul counts as a strike, except that (with minor exceptions) it cannot count as a third strike.
fMRI (functional magnetic resonance imaging) A technique that relies on a special type of machine to study brain activity. It uses a strong magnetic field to monitor blood flow in the brain. Tracking the movement of blood can tell researchers which brain regions are active (using oxygen).
immunity The ability of an organism to resist a particular infection or poison by producing and releasing special protective cells.
major (in education) A subject that a student chooses as an area of focus in college, such as: chemistry, English literature, German, journalism, pre-medicine, electrical engineering or elementary education.
mean One of severalmeasures of the “average” of a data set. Most commonly used is the arithmetic mean, obtained by adding the data and dividing by the number of data points.
multiple sclerosis A degenerative disease of the nervous system, resulting in paralysis. At present there is no known cure.
neurology (or neuroscience) The study of the structure or function of the brain and other parts of the nervous system. Researchers in this field are known as neuroscientists.
noise (in data) Unwanted and random variations that obscure or do not contain meaningful data.
panda (or giant panda) An endangered species in the bear family, found in the wild only in China. It has a distinctive white body with black-coated limbs and dark spots around the eyes.
random Something that occurs haphazardly or without reason, based on no intention or purpose.
Renaissance A period of artistic rebirth in Europe that spanned roughly 1350 to 1600.
significance test In statistics, a test used to determine whether an observed pattern in data is real or could be explained by random variations in the data.
statistics The science of interpreting data, and in particular reducing or estimating errors attributable to random variation.
strike (in baseball) Any of three situations: A swing that misses the ball, a hit that flies into foul territory or a pitch that isn’t swung at but passes over home plate in an area described as a “strike zone” (a region that runs between the batter’s chest and knees).
strikeout In baseball, the end of a batter’s turn that is triggered when a hitter accumulates three strikes. A strikeout is a traditional measure of pitching skill or poor batting.
theory (in science) A description of some aspect of the natural world based on extensive observations, tests and reason. A theory can also be a way of organizing a broad body of knowledge that applies in a broad range of circumstances to explain what will happen. Unlike the common definition of theory, a theory in science is not just a hunch.
tin A metallic element, belonging to the same chemical family as lead, germanium, silicon and carbon.
vaccine A medical compound consisting of a killed or inactivated disease-producing organism, or a compound that resembles the organism, which is intended to produce immunity to the disease.
variance A measure of the amount of “spread” in a dataset to either side of its central, or mean, value.
Word find (click here to enlarge for printing)
This is one in a series on careers in science, technology, engineering and mathematics made possible by support from the Northrop Grumman Foundation.


