Cookie Science: A bit about butter
Here I probe why baking recipes often call for using softened or melted butter
We’re heading back to the kitchen for some science. This time, we’re looking at whether the temperature of butter affects how a cookie turns out.
B. Brookshire/SSP
This article is one of a series of Experiments meant to teach students about how science is done, from generating a hypothesis to designing an experiment to analyzing the results with statistics. You can repeat the steps here and compare your results — or use this as inspiration to design your own experiment.
When you first take butter out of the fridge, it’s cold and tends to be hard. One of the more frustrating things about baking cookies can be waiting for it to soften. Yet that’s precisely what many recipes call for. And if you need to melt your butter, there’s often an extra pan that you’ll need to wash. So is softening butter really necessary?
I teamed up with the ACS Reactions crew from the American Chemical Society to run an experiment and find out.
(Post continues below video)
COOKIE CHEMISTRY Cookies make a great vehicle to study chemistry and the scientific method. Here, I show why different temperatures of butter matter to a recipe. ACS Reactions |
In previous cookie science experiments, I examined how the wheat protein gluten (something that my friend couldn’t eat) affected how cookies look and taste. This time, I’m investigating the fat in those recipes: butter.
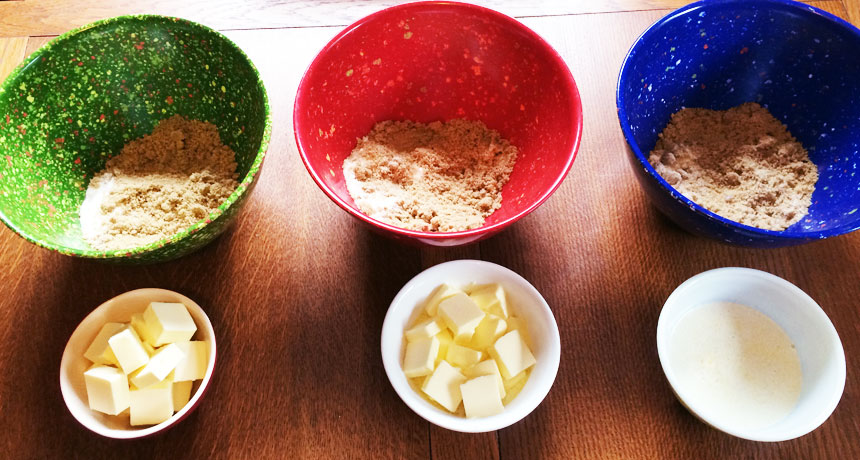
We chose to compare the effects of cold, room temperature and melted butter. Then, I came up with a hypothesis — a proposed explanation — for why I thought butter’s temperature would affect a finished cookie. Cold butter is much more solid than the warmer forms, so I predicted it would produce more solid dough. That suggested to me that a cookie would spread less in the oven, creating smaller diameter cookies. Conversely, melted butter should produce a warm, runny dough that behaves more like a liquid. And this should lead to bigger, flatter cookies.
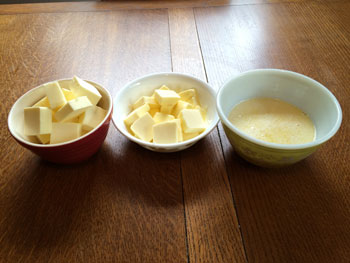
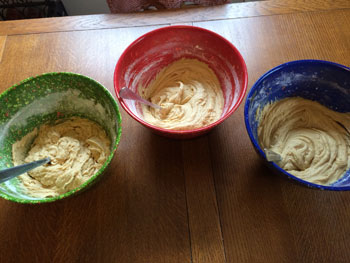
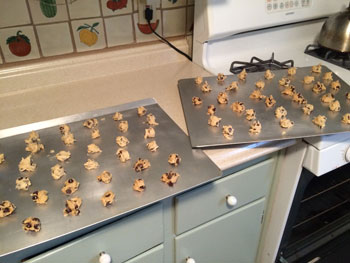
To test this, I baked three batches, each with 24 cookies. I changed just one variable in each recipe: butter temperature. One batch got cold butter. Another got room temperature butter. I melted that fat for the last batch. To make sure my cookies were similar in every other way, I baked all three batches at once. I added each ingredient to each batch at the same time and in the same order.
To make sure I didn’t accidentally plop more dough onto the cookie sheet for some cookies, I used a miniature ice cream scoop to dispense the same amount each time. I also alternated rows of cold, room temperature and melted butter cookies on those cookie sheets to make sure one batch didn’t end up exposed to more heat than another.
Finally, I measured the diameter of the raw dough for each cookie right before baking. Then I measured each again after they came out of the oven. By subtracting the diameter of the raw dough from that of the baked cookie, I came up with a measure of how much each cookie spread during baking.
Then I then used statistical analyses — mathematical processes — to find out if these batches of cookies indeed differed. More information on how I went about analyzing my data can be found in my previous cookie-science posts on statistics.
Briefly, I calculated the mean, or average width of each batch. I also calculated the standard deviation — how much each set varied from that average size. I used that number to calculate the standard error of the mean, which is the likely range of all the widths in all potential batches of cookies. An analysis of variance — or ANOVA test — allowed me to compare more than two test conditions. A so-called post-hoc test let me look for differences after the initial test — ones I may not have predicted.
To make my data easier to understand, I’ve put them in graphs.
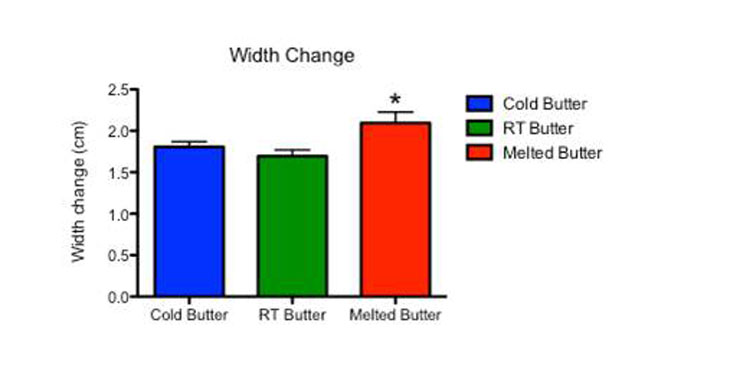
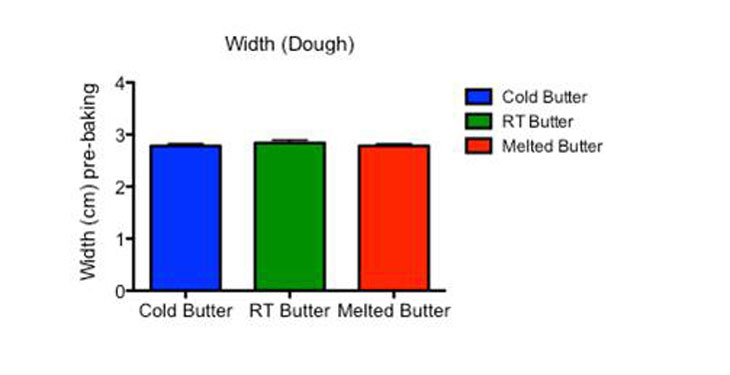
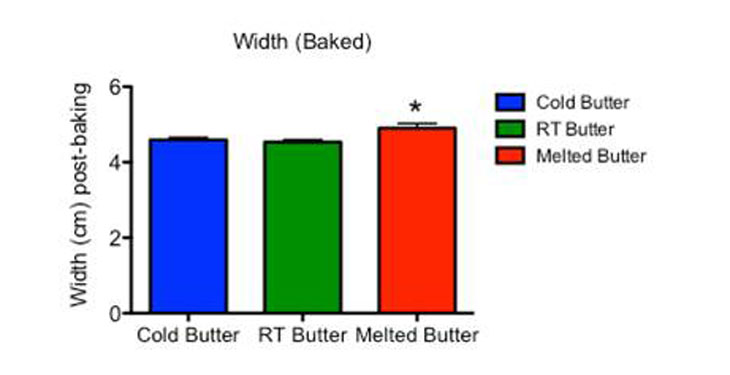
Above you can see the data from the three batches of cookies in side-by-side columns. Data for cold butter are on the left, those for room-temperature butter are in the middle and the melted-butter data are on the right. The height of each bar depicts the mean value for each batch. The little T’s sticking up show the standard error, or how much the data were likely to spread across many batches of cookies.
Finally, in the graphs showing baked-cookie width and spread, there are asterisks above the bar for the melted-butter data. Scientists use such asterisks to identify where one set of data differs significantly from another. The asterisk here indicates there is a low probability that those differences were due to chance, or some fluke.
Asterisks usually indicate a p value — the probability of seeing a difference in future experiments that is as large or larger than the difference in the original experiment. If I find a p value that is very small — less than 5 percent — it suggests that the difference I see in my data is one that reflects the real world. If I see a small p value in this data, it might mean that butter temperature really does make a difference in my cookies.
I have one asterisk. It shows a p value of less than 0.05, or 5 percent. So there is only a 5 percent chance that the difference between cold butter and melted butter was due to a fluke. This indicates there is a 95 percent chance that those differences are really due to butter temperatures.
The results, therefore, confirmed my hypothesis. Cookies made with melted butter spread more than the cookies made with cold butter.
It’s a fun experiment that you can try at home. If you do, please share your results in the comments.
Follow Eureka! Lab on Twitter
Power Words
(for more about Power Words, click here)
ANOVA The acronym for analysis of variance, a statistical test to probe for differences between more than two test conditions.
hypothesis A proposed explanation for a phenomenon. In science, a hypothesis is an idea that must be rigorously tested before it is accepted or rejected.
mean One of several measures of the “average size” of a data set. Most commonly used is the arithmetic mean, obtained by adding the data and dividing by the number of data points.
variable (in mathematics) A letter used in a mathematical expression that may take on different values. (in experiments) A factor that can be changed, especially one allowed to change in a scientific experiment. For instance, when researchers measure how much insecticide it might take to kill a fly, they might change the dose or the age at which the insect is exposed. Both the dose and age would be variables in this experiment.
statistics The practice or science of collecting and analyzing numerical data in large quantities and interpreting their meaning. Much of this work involves reducing errors that might be attributable to random variation. A professional who works in this field is called a statistician.
statistical analysis Mathematical processes that allow a scientists to make conclusions from a set of data.
statistical significance In research, a result is significant (from a statistical point of view) if the likelihood that an observed difference between two or more conditions would not be due to chance. Obtaining a result that is statistically significant means there is a very high likelihood that any difference that is measured was not the result of random accidents.
standard deviation (in statistics) The amount that a set of data varies from the mean.
standard error of the mean (in statistics)The likely distribution of numbers, in a data set, based on a random sample.